Data retrieval vs. analysis
I’ve spent portions of the last four years teaching talented non-technical people how to be analysts either as a core part of their job or to better inform their decision making. The tool I’ve chosen to teach people is SQL, which is the primary data science tool for many organizations - and a good entry level one for non-technical folks to master. It can be used relatively easily given the proliferation of tools on the market that use it as a main interface to databases - Mode, Chartio, Periscope, Looker, etc. It also has a great community and tons of documentation.
The resources that I’ve found most useful over the years to teach others SQL are the following:
- Demonstrating the parallels between Excel vs. SQL
- Business problem (Yammer)
- Syntax Basics
- Asking Data Questions
The following is some synthesis of my own learnings as well as the resources above.
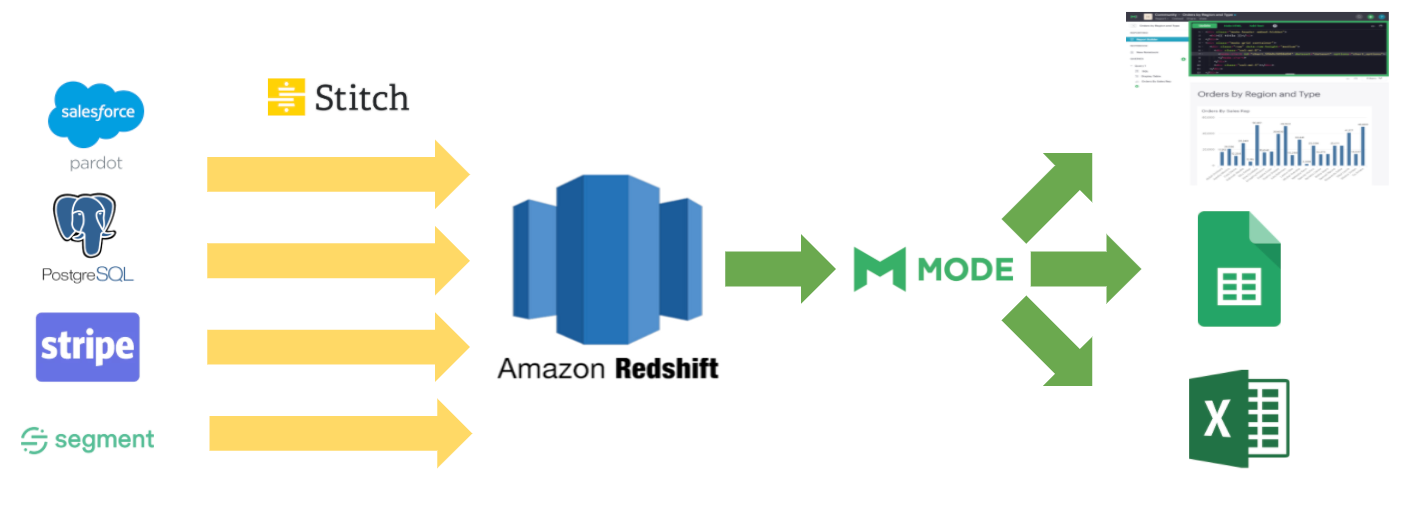
First, the stack I’m most familiar with is the following:
- Postgres - a relational database
- Stitch Data - intermediary ETL tool to manage data pipelines
- Amazon Redshift - a data warehouse that houses many databases
- Mode Analytics - business intelligence tool to mine data with SQL or Python notebooks
- Excel - application to analyze data

There are other tools that are either more advanced or are direct replacements in the pipeline above, but I won’t go into comparing them here.
One consistent area that people tend to get caught up when first studying SQL and creating data products is the important difference between data retrieval and analysis — strong insights almost always necessitate the former precedes that latter.
Bloom’s taxonomy is a decent way of thinking about the layers of creating data products. The layers in the taxonomy are:
- Remember — Who, what, where, or when did something happen?
- Understand — Can you summarize what happened?
- Apply — What happens when …?
- Analyze — What are the key parts and relationships of …?
- Evaluate — Is this the best approach?
- Create — Can you predict what will happen to … under new conditions?
The extent to which one can traverse this taxonomy is dependent on three things:
- The tools one has mastered or has access to
- The question that is being asked
- What data is available
SQL is appropriate when answering data retrieval questions (remember, understand), but not as strong when entering any form of analysis (analyze, evaluate, create). It’s important to be cognizant of this when approaching analysis and query design. A better tool for analysis may be Excel, which is more malleable and extensible. The best tools for analysis are tools such as R, SAS, Pandas, etc.
The very first thing I push people to do as beginner SQL users is to start framing what they are curious about as questions. It’s common for folks at every level of business to ask questions that are evaluative or predictive before answering questions that might form the foundation for those questions.
But bad questions often lead to bad data products and insights.
A good example of a common question in a product-driven company might be: What factors can predict a healthy customer?
The above is an analysis question, but it may require a couple of things before answering it. First, we might need to list all of our customers by dimensions that we have data. Second, we might want to summarize major trends we are seeing. Third, we may want to infer some combination of factors that provide a strong signal.
A good chunk of data retrieval (often by way of SQL) is necessary to even begin a useful analysis of that question (remember, understand). Once that’s done, using tools like Excel or processing languages can help take that next step.
Data retrieval comes before analysis, and SQL is a great tool to do it.
A couple of things to keep in mind:
- It’s human nature to ask evaluative/analytical questions - it’s a good thing! (and it’s more interesting) - but one often needs to break those questions down into data retrieval questions to inform or clarify them
- There may not always be data that supports evaluative questions - in those scenarios, one of three things is often the solution: rely on anecdotal information to inform the analysis, not data; create the data; find a proxy.